The rate of testing for COVID-19 is variable everywhere. As such, using the number of confirmed cases over time is not a reliable method for tracking the spread of the disease.
We should be using deaths per capita
First of all, we should be using per capita statistics. For example, 100,000 cases in China vs 100,000 cases in Ireland would be very different things, because of what they imply for concentration of cases. Per capita (assuming a billion people in China and 5 million in Ireland), this would mean 1% of people in Ireland have the disease compared to 0.01% of people in China: 1 in 100 vs 1 in 10,000. Of course, just using per capita by country, you miss a lot too. A particularly high concentration of cases in Wuhan is not the same as a more even spread of cases throughout China. You can fix this by dividing by province or county (if you have that level of granularity in your data); I do this by state for the US. I’m going to use per million people instead of per capita, because it’s a bit easier to think about.
Second, reported deaths from the virus are more reliable than confirmed cases. That’s because the more ill you are, the more likely you are to get a test. The number of people reported to have died of COVID-19 infection will be closer to the true number of people who died of COVID-19 than the number of people reported to be infected will be to the true number of infected individuals.
For timelining, I’ll use days since the tenth confirmed death from COVID-19.
Deaths per capita will lag other measures
I don’t mean to say that deaths per capita is the only useful thing. It actually lags other measures (in particular the number of infected individuals) by a few days because the disease does not kill quickly. In particular, if a countries rate of testing is steady or increasing but the absolute number of people testing positive per day is decreasing, that’s a great sign and a sign that you’ll see sooner than a drop in deaths.
Data source, preparation and limitations
Johns Hopkins University Center for Systems Science and Engineering (JHU CSSE) has put together a great COVID-19 data repository. Note that I’ve smoothed the data to make the plots more readable. This means that only sustained changes will appear on the plots (e.g. a one-day drop in deaths will be smoothed out). This is a good thing as it prevents us from reading too much into single data. Bear in mind that different countries have different measurement methods and capabilities, so they aren’t strictly comparable. However, provided that within a given country, the measurements are done in a consistent manner, one can still do reliable comparisons of the shapes of the countries’ curves.
World data
All countries
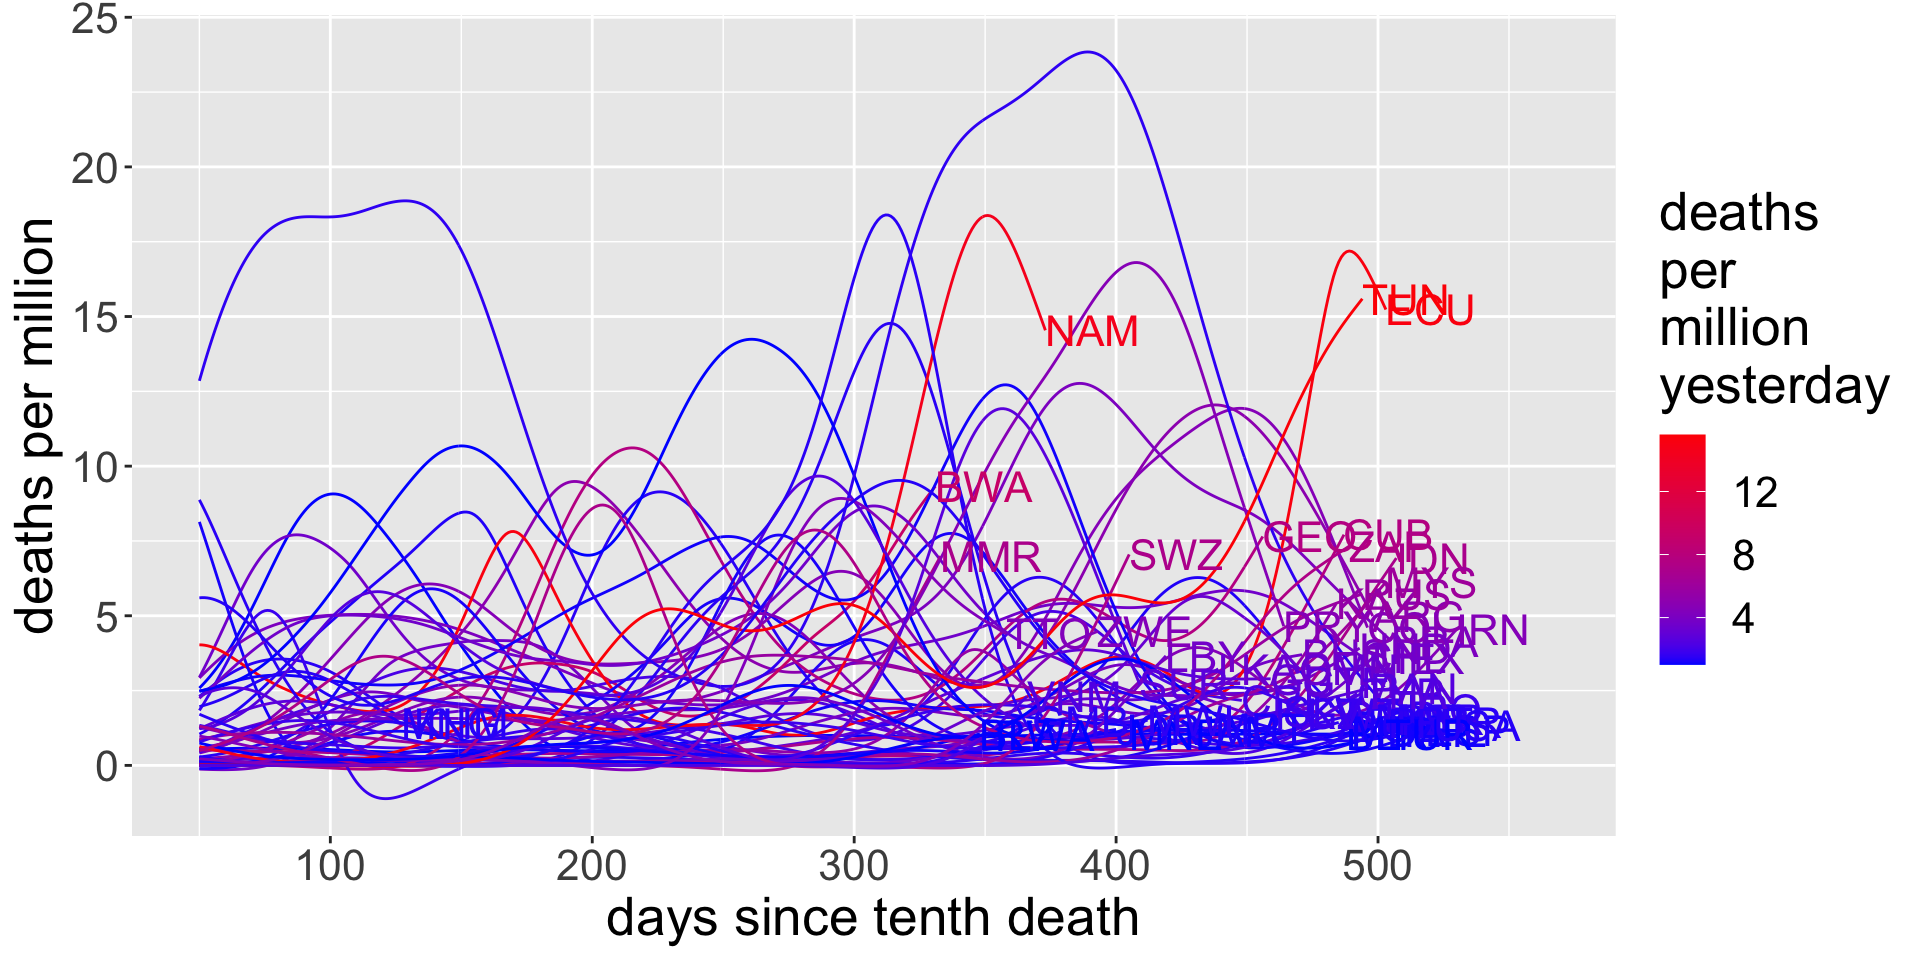
I’m going to limit the data to countries that have reported at least 100 deaths. First up, I’ll just plot all of these countries. I’ll give a table of country codes at the end. Note that the data is not cumulative: each data point is deaths per million on that day. The lines are colored by how bad the situation is in that country right now: how many deaths there were there yesterday.
US data
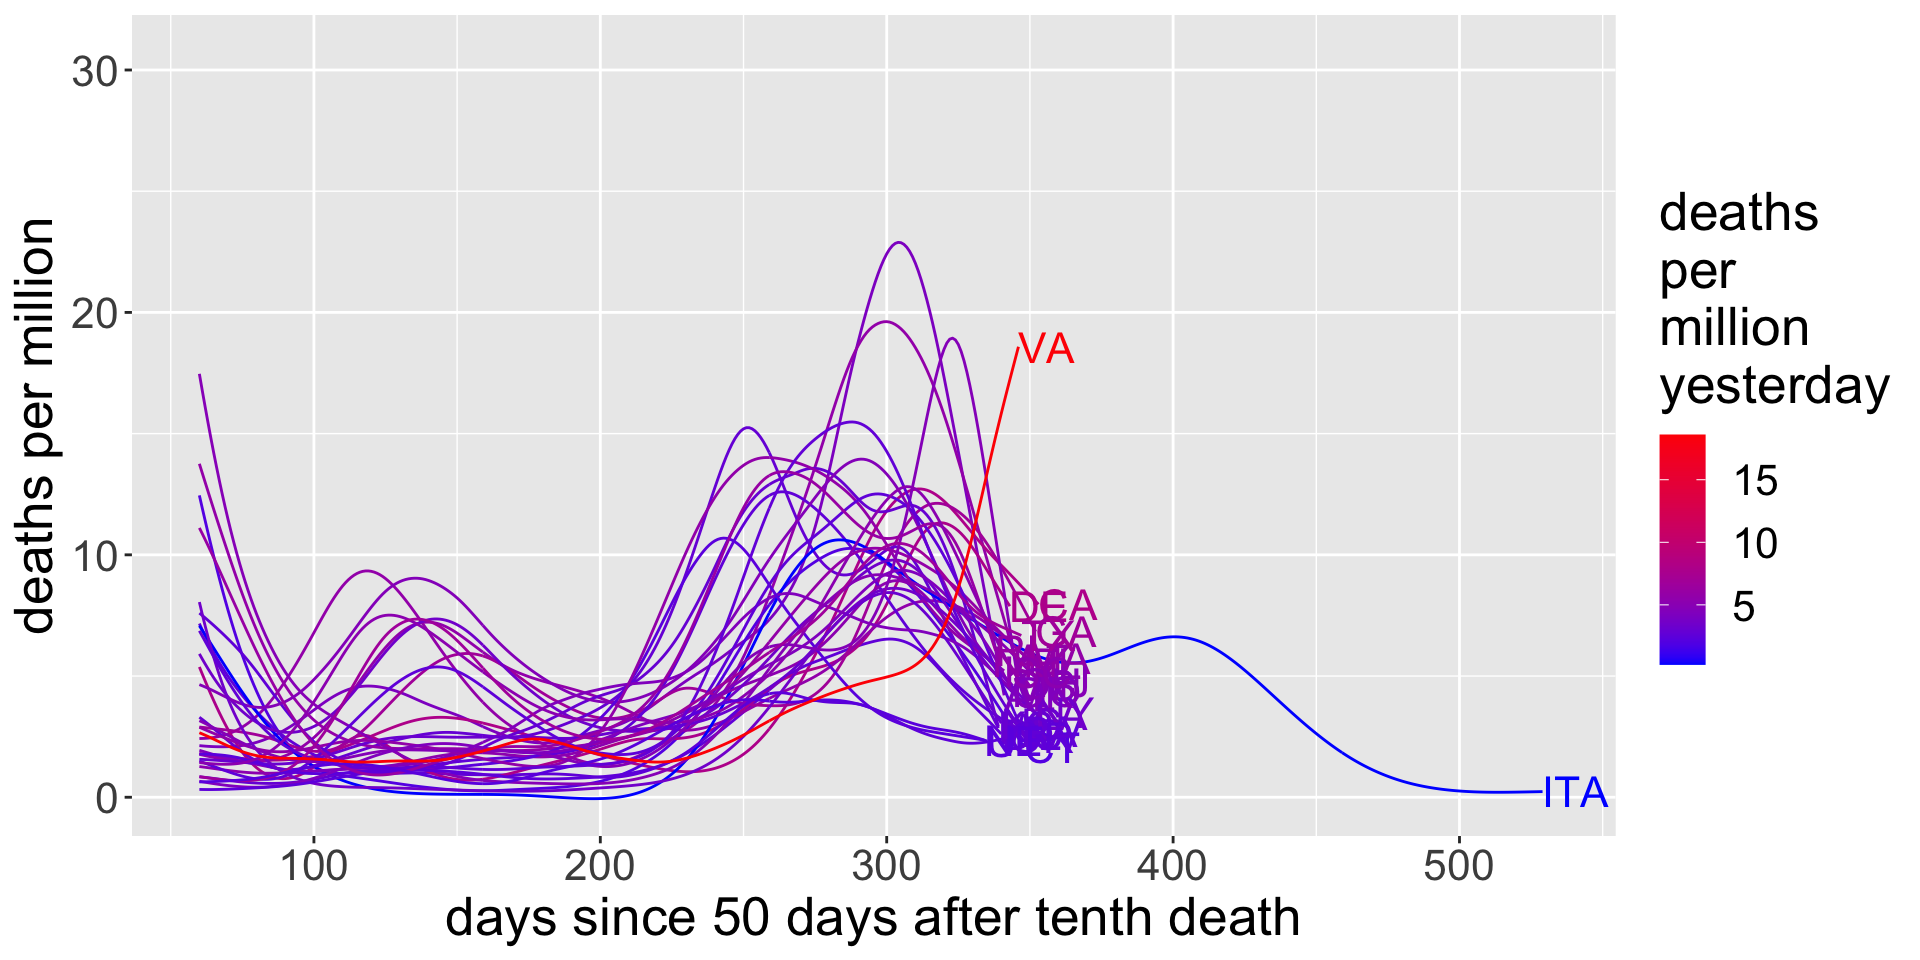
I’m going to use the same limitations for the US state data: states with at least 100 deaths. For reference, I’m also going to include Spain and Italy.
Appendix
| iso3c | country | iso3c | country | iso3c | country |
|---|---|---|---|---|---|
| AFG | Afghanistan | ECU | Ecuador | MEX | Mexico |
| ARE | United Arab Emirates | EGY | Egypt | MYS | Malaysia |
| ARG | Argentina | ESP | Spain | NGA | Nigeria |
| AUT | Austria | FIN | Finland | NLD | Netherlands |
| BEL | Belgium | FRA | France | NOR | Norway |
| BGD | Bangladesh | GBR | United Kingdom | PAK | Pakistan |
| BIH | Bosnia and Herzegovina | GRC | Greece | PAN | Panama |
| BLR | Belarus | HND | Honduras | PER | Peru |
| BOL | Bolivia | HUN | Hungary | PHL | Philippines |
| BRA | Brazil | IDN | Indonesia | POL | Poland |
| CAN | Canada | IND | India | PRT | Portugal |
| CHE | Switzerland | IRL | Ireland | ROU | Romania |
| CHL | Chile | IRN | Iran | RUS | Russia |
| CHN | China | IRQ | Iraq | SAU | Saudi Arabia |
| CMR | Cameroon | ISR | Israel | SRB | Serbia |
| COL | Colombia | ITA | Italy | SVN | Slovenia |
| CZE | Czechia | JPN | Japan | SWE | Sweden |
| DEU | Germany | KOR | Korea, South | TUR | Turkey |
| DNK | Denmark | LUX | Luxembourg | UKR | Ukraine |
| DOM | Dominican Republic | MAR | Morocco | ZAF | South Africa |
| DZA | Algeria | MDA | Moldova |